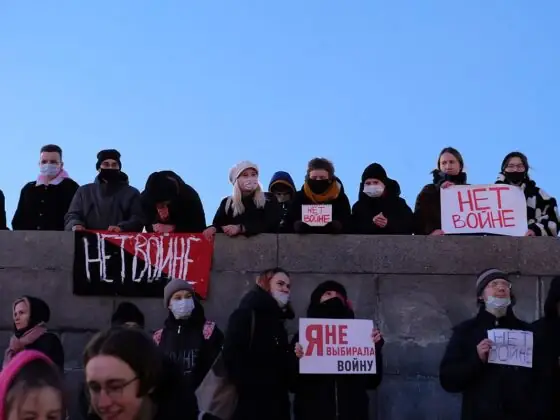
After Russia’s 2022 invasion of Ukraine, understanding the political attitudes of Russia’s ethnic minority population has become increasingly important. Although ethnic Russians constitute 81 percent of Russia’s population (2021 Census), non-Russians have assumed a prominent role in both the invasion and discussions about Russia’s future. Ethnic minority populations appear to be over-represented in Russian forces fighting in Ukraine; protests against troop mobilization efforts have broken out in multiple predominantly non-Russian regions of Russia; and ethnic minority organizations have been prominent among Russian expatriate resistance to the invasion and Russian President Vladimir Putin himself.
Given this context, the degree to which ethnic minorities in Russia currently support A) Russia’s invasion of Ukraine and B) the Russian government has clear implications for both the success of the invasion and the stability of the Russian state. This memo sheds light on this topic using data from November 2022 surveys of two important Russian regions that are home to large non-Russian minority populations: Tatarstan and Buryatia. It finds that ethnic Tatars in Tatarstan and ethnic Buryats in Buryatia are less supportive of both the Russian invasion of Ukraine and Putin than ethnic Russians in these regions. While these results should be interpreted with caution given a small sample size, they constitute evidence that there is substantial ethnic variation along two critically important metrics.
Ethnic Politics in Buryatia and Tatarstan
The Republic of Buryatia and the Republic of Tatarstan are both autonomous republics in the Russian Federation, meaning that they are the institutionally-designated historical homelands of their “titular” ethnic groups, the Buryats and Tatars. Tatarstan is a large and populous region (over four million residents per the 2021 Census) located in the Russian Volga region; ethnic Tatars are historically Muslim and speak a Turkic language closely related to Kazakh. Buryatia is also a relatively large but less populous region, with a population slightly below one million per the 2021 Census; it is located in the Russian Far East. The Buryats are a traditionally Buddhist ethnic group who speak a language closely related to Mongolian.
Both Buryatia and Tatarstan have a relatively high concentration of members of their titular groups: according to the 2021 Census, ethnic Tatars represent 54 percent of the population of Tatarstan, while ethnic Buryats make up 32 percent of Buryatia’s population. However, both regions are also home to substantial ethnic Russian populations: according to the 2021 Census, ethnic Russians make up 40 percent of Tatarstan’s population, while Russians represent 64 percent of Buryatia’s population.
In addition to being ethnically diverse, Buryatia and Tatarstan are important for Russian politics because they both attained a relatively high level of regional sovereignty in the 1990s, with Tatarstan at the forefront of Russian regional sovereignty movements and Buryatia in the middle.[1] Although recentralization under Putin has largely curtailed regional sovereignty over the last several decades,[2] both Buryatia and especially Tatarstan are likely cases of opposition to the federal government if the legacy of regional sovereignty affects present-day political behavior.
At the same time, if ethnic identity affects political beliefs, the diversity of both regions also means that there is likely to be substantial within-region variation in public opinion.
Inter-ethnic Variation in Public Opinion in Buryatia and Tatarstan
The Levada Center fielded regionally-representative telephone surveys of Buryatia and Tatarstan November 25-27, concurrently with its monthly face-to-face nationally representative omnibus survey (November 24-29).[3] All surveys included the same questions regarding support for both Putin[4] and the activities of Russia’s armed forces in Ukraine (a standard proxy for support for the invasion).[5] As an overarching caveat for the data, both question-wording effects and preference falsification (dissembling) may affect estimates of support for both items.[6] As a result, this memo largely focuses on differences between populations as opposed to absolute levels.
To investigate whether or not the populations of Buryatia or Tatarstan diverge substantially from the Russian population as a whole, I use two-sided t-tests to compare the regionally representative surveys to the nationally representative data. Table 1 reports the results from this analysis. The top rows show the percentage of respondents in a given category (residents of the Russian Federation, Buryatia, or Tatarstan) who support either Putin (left columns) or the invasion of Ukraine (right columns). The bottom row shows the difference between residents of the Russian Federation and residents of each of the two regions along both of these metrics, with corresponding 95 percent confidence intervals (CI).[7] If anything, residents of both Buryatia and Tatarstan tend to be more supportive of Putin than residents of the Russian Federation as a whole, though the difference is not statistically significant (at the conventional 0.05 level) for either region. In contrast, the residents of both regions tend to be less supportive of the Russian invasion of Ukraine, with a difference of seven percentage points for residents of Buryatia and five percentage points for Tatarstan; the difference between residents of Russia overall and residents of Buryatia is statistically significant.
Table 1: Regional Variation in Support for Putin and the Invasion of Ukraine

I next examine inter-ethnic variation in both regions. The results of these analyses are more straightforward: ethnic Buryats and Tatars tend to evince lower support for both Putin and Russian military activities in Ukraine, relative to ethnic Russians in the respective regions. Although the low sample size of ethnic Buryats in Buryatia (N=49) means that these results are somewhat tentative (see Table 2), they indicate that ethnic Buryats are 19 percentage points less likely to support Putin (95% CI: -33%, -5%) and nine percentage points (95% CI: -25%, 7%) less likely to support the invasion of Ukraine. Ethnic Tatars are seven percentage points (95% CI: -17%, 3%) less likely to support Putin than ethnic Russians in Tatarstan, and 19 percentage points (95% CI: -32%, -7%) less supportive of the activities of the Russian armed forces in Ukraine. While these differences are only statistically significant in half of the region-item combinations, the consistent directionality is highly suggestive.
Table 2: Ethnic Variation in Support for Putin and the Invasion of Ukraine in Buryatia and Tatarstan

Given the relatively small sample size and concerns about confounding variables, I conduct additional statistical analyses of the telephone surveys. Specifically, I pool these data with the November face-to-face omnibus survey, and estimate a Bayesian hierarchical regression model that accounts for demographic, ethnic, and regional variation, as well as mode-of-survey effects.[8]
Figures 1 and 2 present the results of these analyses for support for Putin and the activities of the Russian armed forces in Ukraine, respectively. The estimated probability that an ethnic Russian in each of the regions supports either Putin or the activities of the Russian armed forces is represented by horizontal black lines, representing 95 percent credible regions (CR, a Bayesian corollary of confidence intervals) about the point estimate. The estimated probability of support by a member of the titular population of a given autonomous region is represented by yellow or red horizontal lines representing the 95 percent CR about the point estimates, with red illustrating these quantities for Buryatia and Tatarstan. Note that the extremely low sample size for titular populations aside from those of Buryatia and Tatarstan makes the estimates in yellow highly tentative; I include them mainly as points of reference.
Figure 1. Estimated Probability that a Titular vs. Ethnic Russian Resident of Different Regions Supports President Putin, Conditional on Demographic Characteristics

Figure 2. Estimated Probability that a Titular vs. Ethnic Russian Resident of Different Regions Supports the Activities of the Russian Armed Forces in Ukraine

Both figures are in line with the t-test results. As Figure 1 illustrates, I estimate that an ethnic Buryat in Buryatia is 13 percentage points (95% CR: 1%, 26%) less likely to support Putin than an equivalent ethnic Russian, after controlling for demographics. Similarly, I estimate that an ethnic Tatar in Tatarstan is eight percentage points (95% CR:-1%, 18%) less likely to support Putin than an equivalent ethnic Russian. The results regarding support for the invasion of Ukraine are similar, as Figure 2 illustrates. I estimate an ethnic Buryat in Buryatia to be nine percentage points (95% CR: 0%, 20%) less likely to support the activities of the Russian armed forces in Ukraine than an equivalent Russian; for Tatars in Tatarstan, the equivalent difference is 11 percentage points (95% CR: 3%, 21%).
Conclusion
Analyses of data from November 2022 suggest that ethnic Buryats and Tatars diverge from ethnic Russians in Buryatia and Tatarstan (respectively) along two critical public opinion metrics: they are less likely to support both Putin and the 2022 invasion of Ukraine. In addition to demonstrating that there are substantial inter-ethnic cleavages in public opinion in two important regions, this finding has two additional implications for understanding Russian politics.
First, although Tatarstan has been a relatively restive autonomous republic over the last several decades, Buryatia has not. The fact that similar patterns in public opinion are visible in both regions thus indicates that inter-ethnic differences are not restricted to regions at the high end of the historical mobilization spectrum. Evidence from analyses of the nationally-representative Levada survey provides some tentative additional evidence that Buryatia and Tatarstan are not unique in this regard: as Figure 2 illustrates, the titular populations of three of the remaining nine autonomous republics in the sample (Bashkortostan, Chuvashia, and Dagestan) also evince lower support for the invasion of Ukraine than ethnic Russians in these territories, albeit with high statistical uncertainty.
Second, Russia’s inter-ethnic public opinion cleavages are not necessarily visible when looking at regional averages:[9] both Tatarstan and Buryatia have similar levels of overall support for Putin as the national average; only Buryatia has a substantially lower level of support for the activities of the Russian armed forces in Ukraine. As a result, the fact that public opinion data indicate autonomous regions tend to have intermediate to relatively high levels of support for the Russian federal government and its activities (Figures 1 and 2) may mask important differences in opinion within these regions. Regionally representative data are thus essential to understanding regional public opinion and political behavior.
As a final note, although I have endeavored to sidestep concerns about the sensitivity of political questions and the concomitant possibility of preference falsification by focusing on differences in levels of support, as opposed to absolute values, the analyses in this memo nevertheless assume that preference falsification is constant across regions and ethnic groups. These are not necessarily safe assumptions in the context of Russia.
Many of the regions that appear to have relatively high support for both Putin and the invasion of Ukraine in the nationally representative data (Figures 1 and 2) have also had relatively low scores on regional democracy ratings; other regions like Russia-occupied Crimea and the republics of the North Caucasus have a high-security presence. The correlation between the plausibility of repression and regional support for the federal government could imply that some of the estimated support in these regions is, in fact, due to preference falsification.
Similarly, as scholars like Guzel Yusupova have documented, ethnic politics are sensitive in Russia. The sensitivity of ethnic politics could, in turn, make minority populations particularly attuned to the sensitivity of politics in general, increasing the likelihood they would feel compelled to inflate their support for the government. If this is the case, the analyses in this memo may actually underestimate the extent of differences between ethnic Russians and minority populations.
Appendix
Methodological Details of Bayesian Hierarchical Analyses
I use Bayesian hierarchical regression analysis to estimate the relationship between region, ethnic identity, and support for Putin and the invasion of Ukraine. To do so, I pool the two telephone surveys with the data from the November face-to-face omnibus. To account for regional variation, I include indicators for all regions in the omnibus; to account for ethnic identity, I include both an indicator for non-Russians and indicators for the titular population of each of the 11 autonomous republics in the Levada omnibus. I also control for age, education, income, gender, and residency in a rural locality. I also include an indicator for the telephone survey data to account for differences in this mode of interview.
Specifically, I use the following model to estimate support for Putin:

Here I indexes the 2,101 respondents (the 1,601 omnibus respondents and 500 telephone respondents), j the 57 regions in the sample, n the 11 titular groups in the sample, k the four region types (oblast, krai, federal city, and autonomous republic), and m each of the eight federal districts.
The probability that a respondent supports Putin is a function of an overall intercept, a weighted vector of dichotomous covariates (self-reported gender, age, higher education, residency in a rural locality, perceptions of economic well-being, and non-Russian ethnicity), mode of interview effect (telephone vs. face-to-face), and region and titular x region effects (the latter only in autonomous republics).
I cluster regional effects by federal district (a rough proxy for geography) and administrative status (autonomous republic, federal city, krai, or oblast). Given the small number of regions with titular populations (11), I cluster titular effects only by an overall average. Clustering is an inherently conservative approach to estimating differences since it drags individual regional effects toward an overall average.
The estimation strategy for support for the activities of the Russian armed forces in Ukraine is identical to that for support for Putin, save that ɑ is replaced by three thresholds corresponding to the boundaries between the four response categories. Accordingly, the outcome is also estimated according to a categorical distribution.
Analyses of Inter-ethnic Differences Using Nationally Representative Data
I use data from the November 2022 Levada omnibus survey to estimate the difference between ethnic Russians and two groups of non-Russians (both all members of this category and those who belong to the titular ethnic group of their region) using two-sided t-tests. Table A1 reports the results of these analyses. In the case of both support for Putin and the activities of the Russian armed forces in Ukraine, the difference between ethnic Russians and both non-Russians in general and members of titular ethnic groups is not sufficient to reject the null hypothesis of no difference.
Table A1: Ethnic Variation in Support for Putin and the Invasion of Ukraine

[1] For example, Elise Giuliano provides Tatarstan with the highest score (12 out of 14) and Buryatia a median score (4 out of 14) in her index of regional secessionism, which consists of the number of secessionist acts in which the governments of 16 Russian autonomous republics engaged between 1989 and 1994.
[2] The December 2022 vote by Tatarstan’s legislative assembly to rename the region’s highest official “rais” (Arabic for “leader”) in light of Russian legislation that forbade the use of “president” in this context, is perhaps the most recent evidence of at least symbolic resistance to recentralization. The title of Buryatia’s highest official was renamed “head” from “president” in 2012.
[3] The cooperation rate for the omnibus survey is 46 percent, in line with other Levada omnibus surveys over the past two years.
[4] The question reads “Do you on the whole support or not support the activities of Vladimir Putin as President of Russia?” with possible responses of “Yes” or “No.”
[5] The question reads “Do you personally support or not the activities of the Russian armed formed forces in Ukraine?” with four response categories: “Definitely yes,” “Probably yes,” “Probably no,” and “Definitely no.” For the t-tests, I dichotomize the response categories; for the Bayesian hierarchical regression analyses I use the full response scale.
[6] Although recent work has raised concerns about the methods scholars use to estimate preference falsification in surveys in Russia, other scholars have consistently found evidence of this phenomenon in the context of support for the invasion of Ukraine.
[7] The Levada omnibus includes respondents from both Buryatia and Tatarstan (16 and 12 respondents, respectively), whom I include in the nationally representative sample.
[8] I provide additional methodological details in the Appendix.
[9] T-test analyses of the nationally representative Levada omnibus data indicate that these cleavages are also not necessarily visible at the national level, where ethnic Russians and non-Russians have similar average levels of support for both Putin and the activities of the Russian armed forces in Ukraine. See the Appendix for additional details.
Kyle L. Marquardt is Associate Professor in the Department of Comparative Politics at the University of Bergen.

